Illustrate and Convey your Client's Procceses
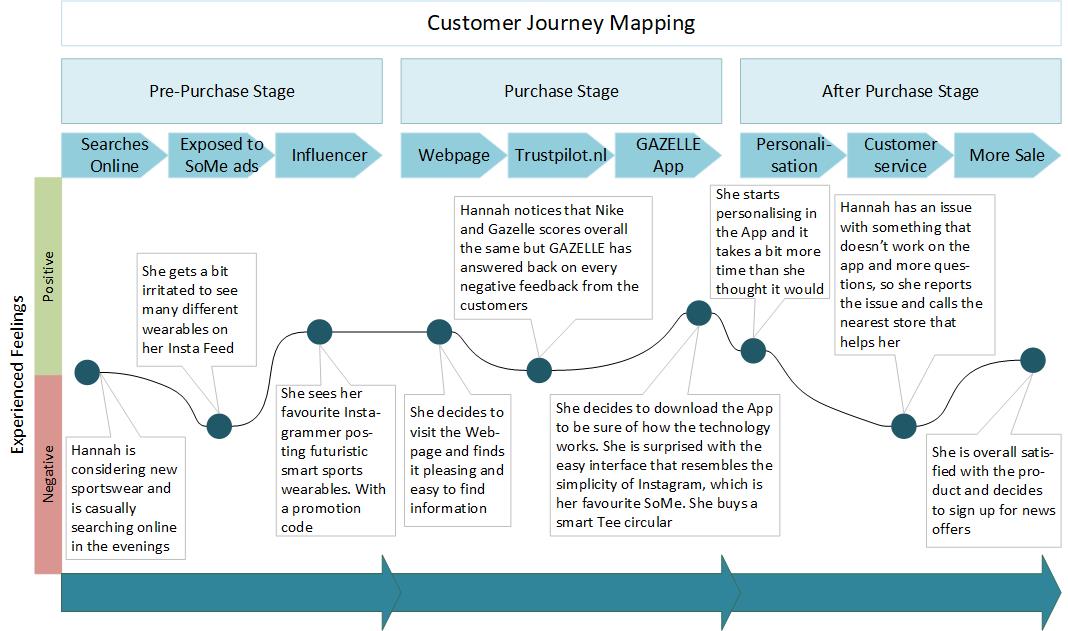
Process Mapping and customer journey mapping
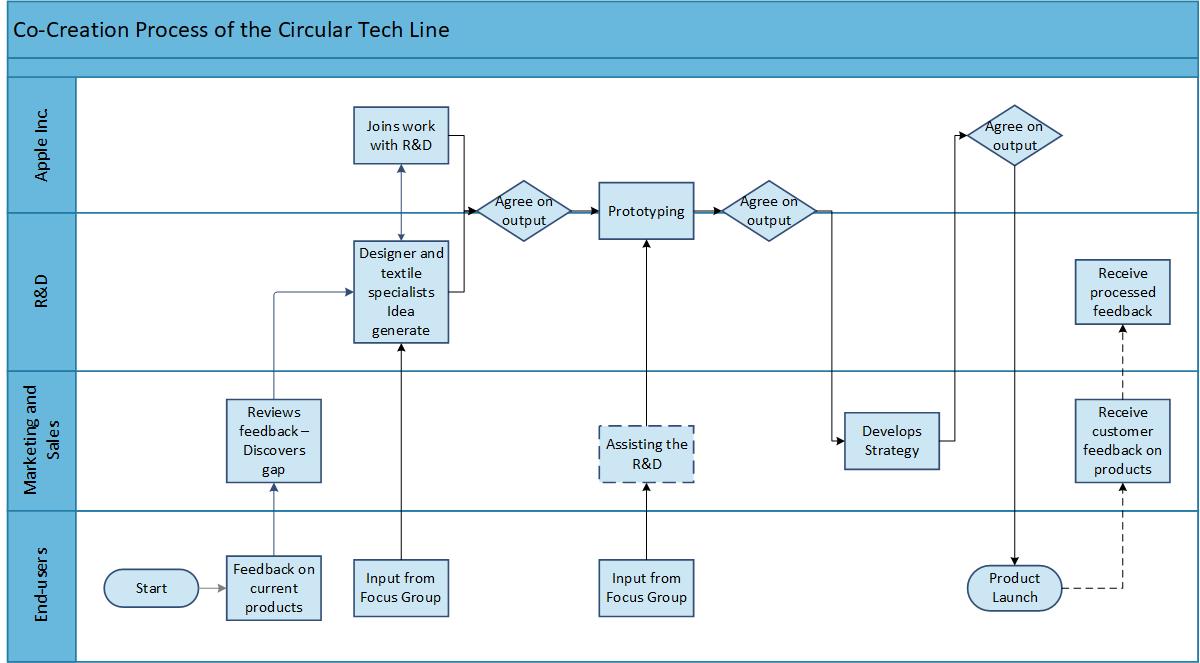
The best thing about working with projects in digitalisation is to delete process steps and make things less complicated for the client. However, in order to know which steps to alter or to identify the problem you need to skecth the process. The real process. Not the one that the client shows you but the one that they actually do. I overcome this problem by
The best thing about working with projects in digitalisation is to delete process steps and make things less complicated for the client. However, in order to know which steps to alter or to identify the problem you need to skecth the process. The real process. Not the one that the client shows you but the one that they actually do. I overcome this problem by
- I gain access to the current process map (if any)
- I listen to and Interview different users of the digital system
- I draw the current process digitally preferably in Visio
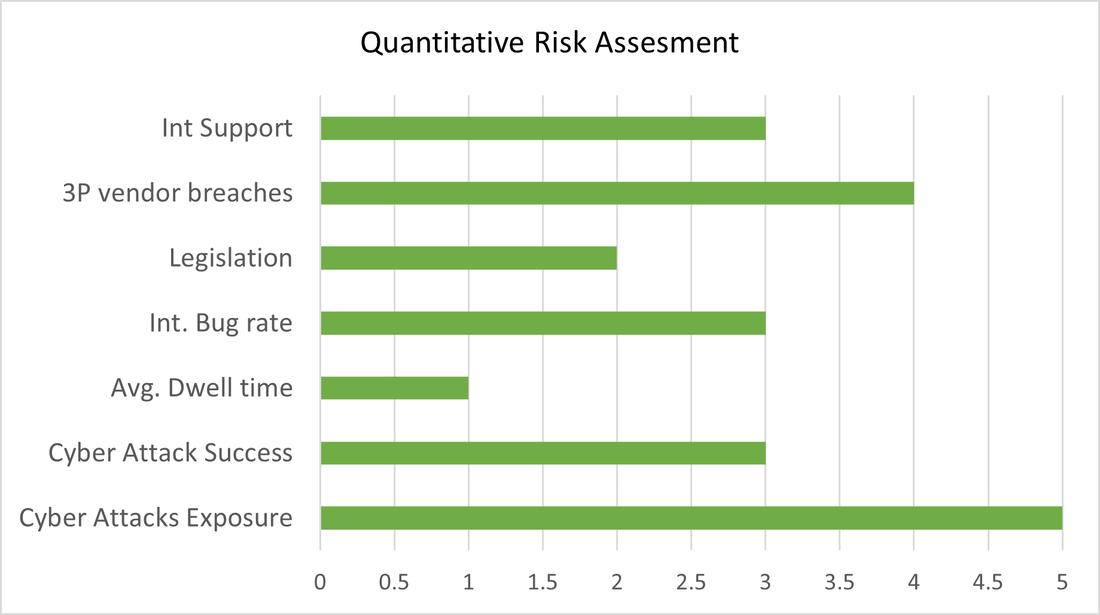
Quantify your Client's Risk Assesment with Metrics
|
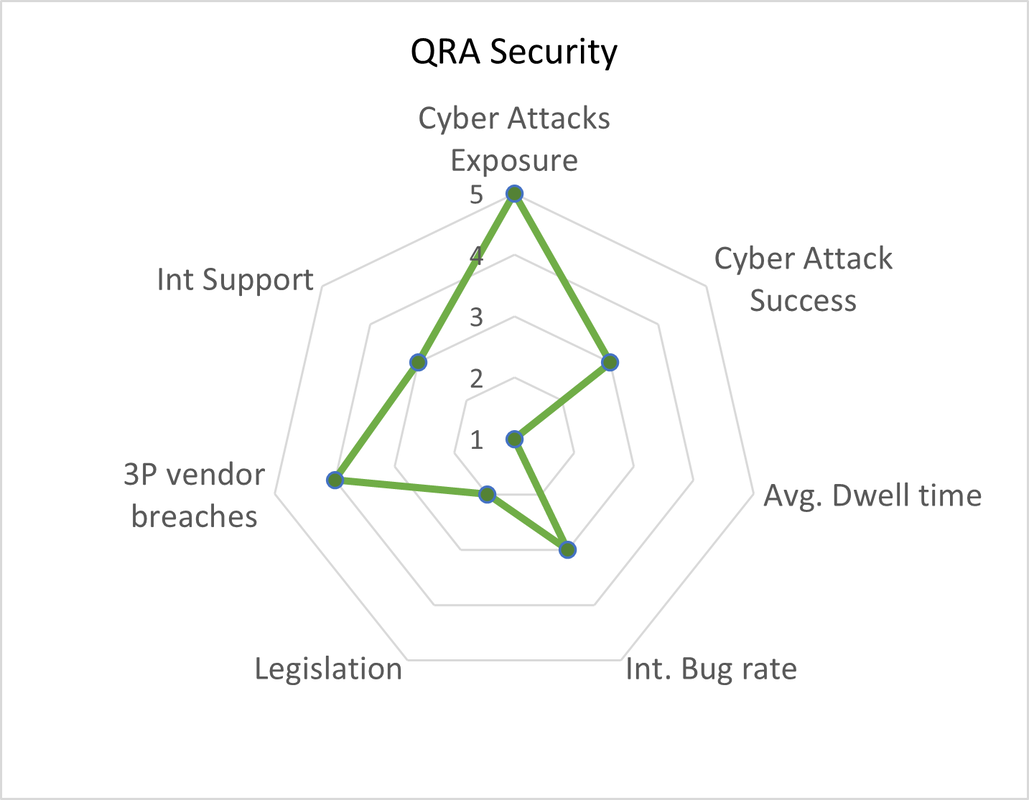
Quantitative Risk Assesment
Improve your risk assesments with clear metrics and objectives. This gives you:
On the left I have made a simple spiderweb illustration of 7 imaginative risk categories using Excel. |
All the models and graphs shown on this page are made using Visio and Excel. These models are pure fiction and do not represent actual work for clients as those are confidential.
Why should you hire me?
|
As an employee in Consulting
|
My Motivation to work in consulting
|
